Command-Line
BSL propose to use 3 of its main classes from the command line:
For each command, the flag -h can be used to obtain additional information.
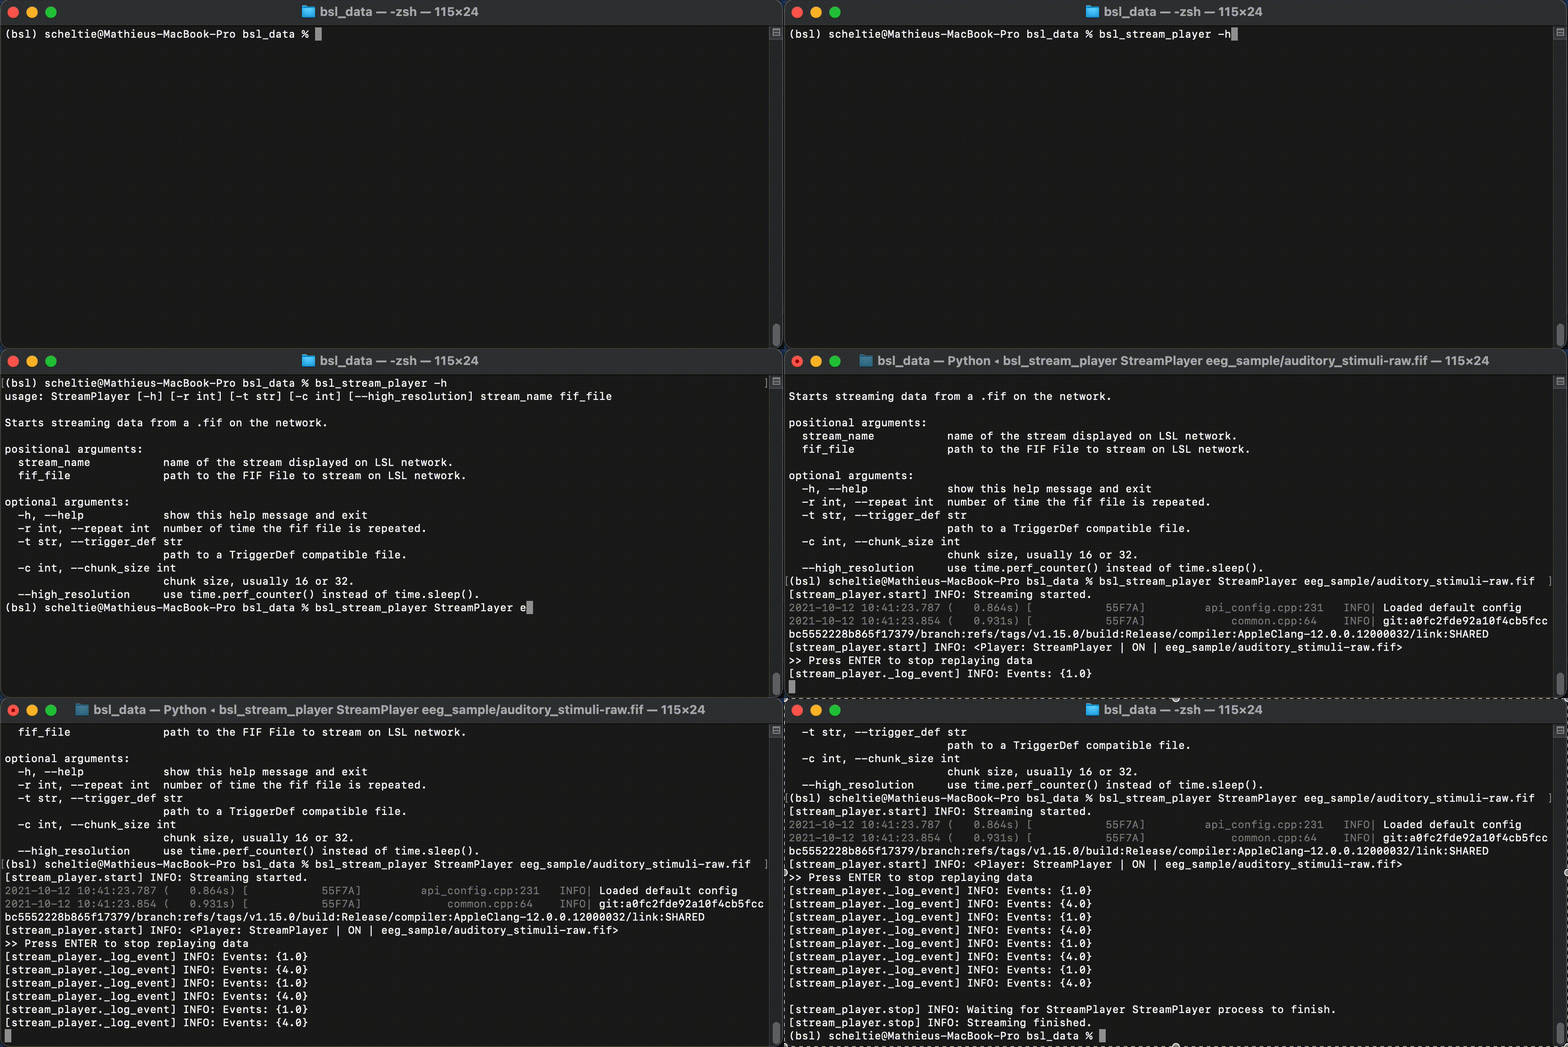
StreamPlayer
The StreamPlayer can be called from the command-line with:
$ bsl_stream_player stream_name fif_file
With the positional arguments:
stream_name:str, name of the LSL stream displayed on the network.fif_file: file-like, recorded fif file by the StreamRecorder.
With the optional arguments:
r,--repeat:int, number of time the file is repeated. Default+inf.-t,--trigger_def: file-like, trigger file mapping events id to strings, loaded byTriggerDef.-c,--chunk_size:int, chunk size pushed on the outlet. Default16.--high_resolution: boolean flag, usestime.perf_counterinstead oftime.sleep.

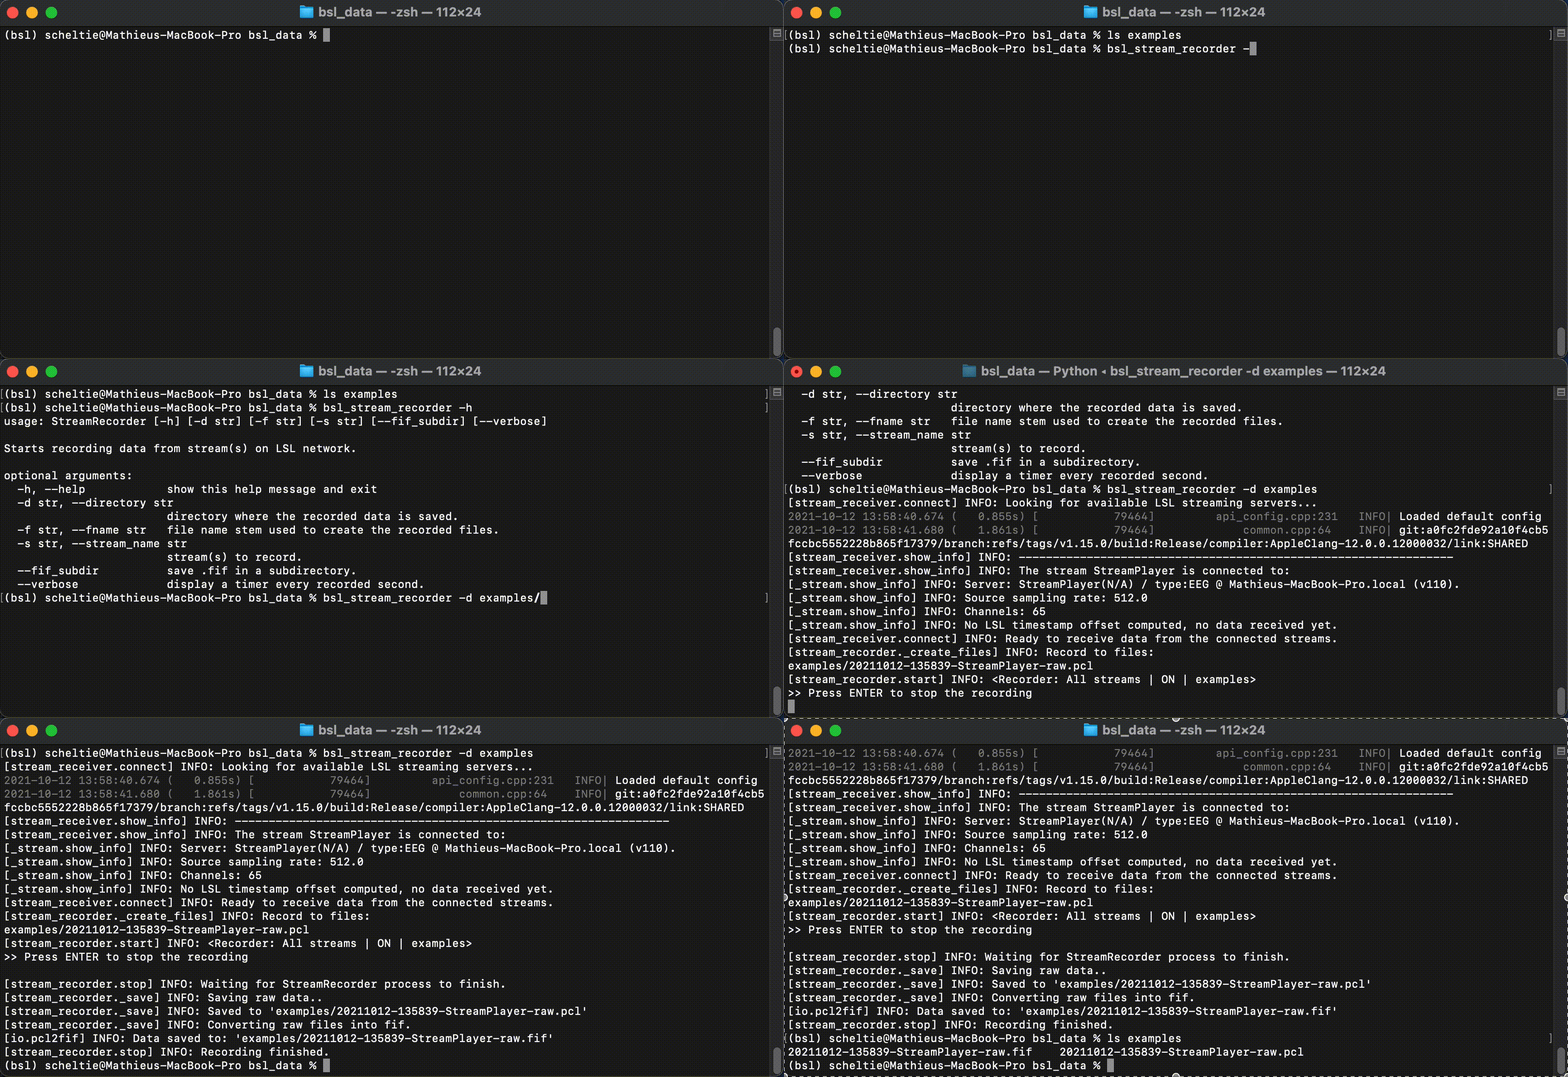
StreamRecorder
The StreamRecorder can be called from the command-line with:
$ bsl_stream_recorder
With the optional arguments:
-d,--directory: path-like, path to the record directory.-f,--fname:str, file name stem.-s,--stream_name:str, stream to record.--fif_subdir: boolean flag, saves in afifsubdirectory.--verbose: boolean flag, displays a timer every recorded second.
Note
If directory is not provided, the current working directory is used.
If fname is not provided, a stem is generated based on the current
datetime. If stream_name is not provided, all available streams are
recorded.

StreamViewer
The StreamViewer can be called from the command-line with:
$ bsl_stream_viewer
With the optional arguments:
-s,--stream_name:str, stream to visualize.
Note
If stream_name is not provided, a prompt is displayed to select a
stream among the available ones.
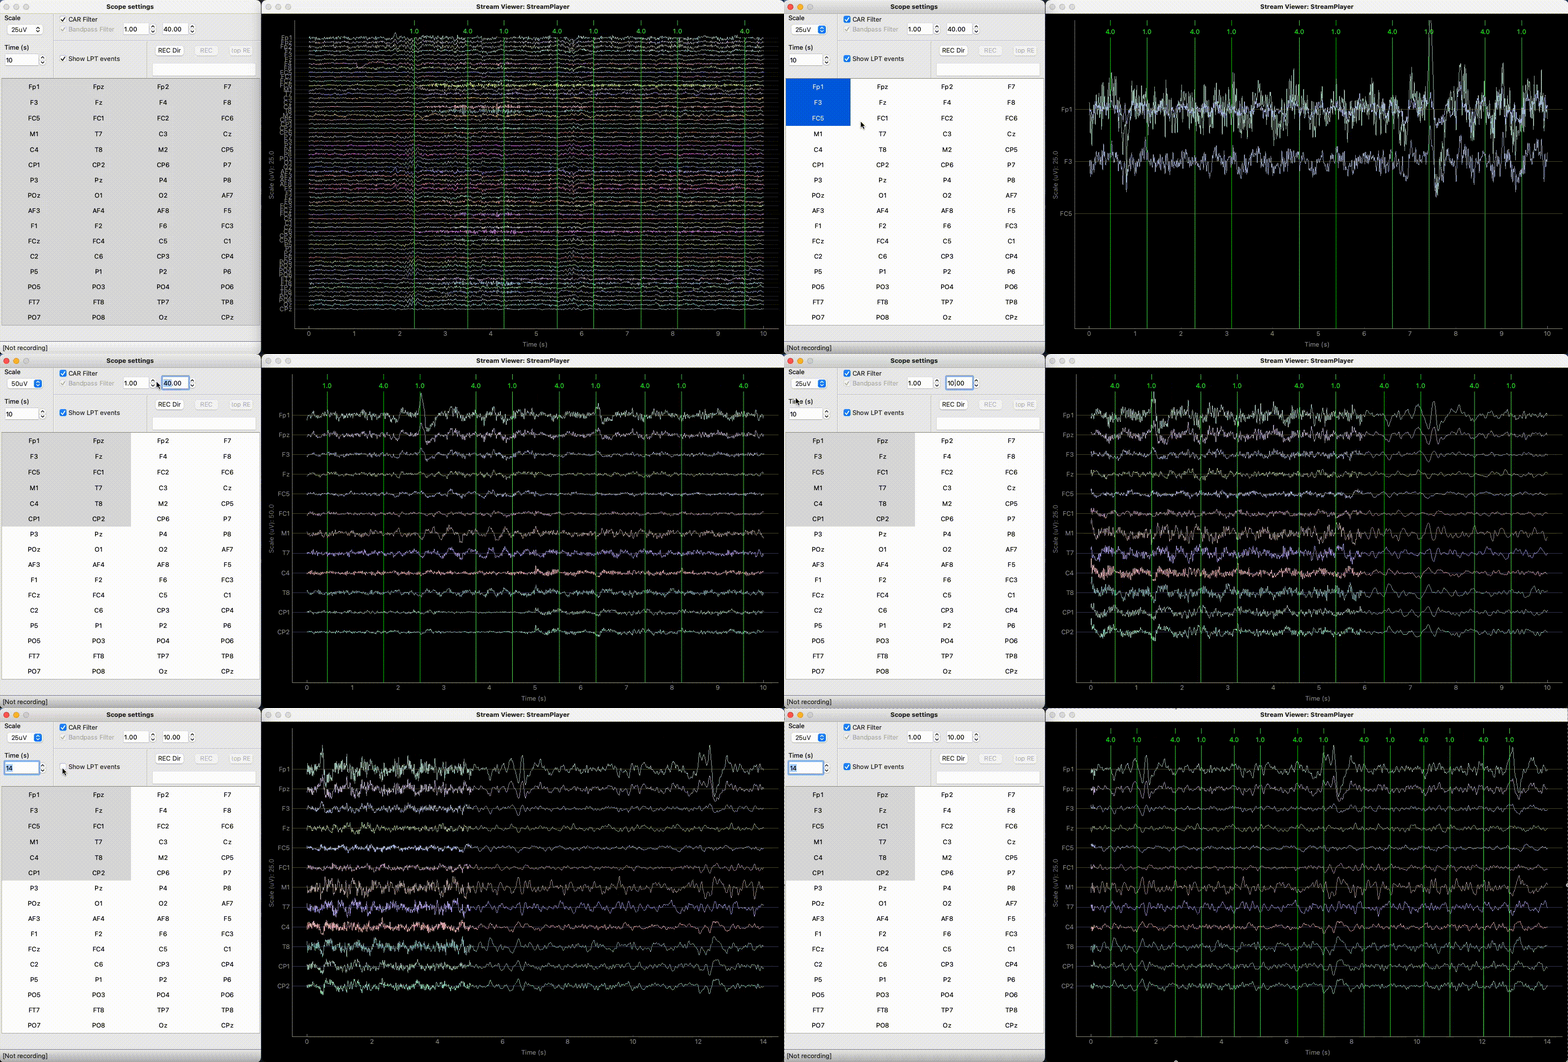
The StreamViewer opens 2 windows:
A controller to select the channels to plot and set different plotting parameters.
A plotting window using the
pyqtgraphbackend displaying the signal in real-time.
